
In some markets, inventory is more than 50% higher than this time last year. Why are these markets among them?
December 20, 2022 Connor Christie
After a spectacular housing market run due to low interest rates and limited supply, the market has seen some significant changes over the past few months. With the spike in interest rates and fewer buyers looking to take the plunge until they see where the market is heading, homes have begun to sit on the market longer. The result? A noticeable increase in inventory levels.
At the end of November within the Bright footprint, inventory rose 21.9% from last year, with 49 of the 87 counties in the region witnessing a 10% or greater increase in inventory.
What’s Causing the Shift?
A combination of higher interest rates and uncertain economic conditions in the second half of 2022 caused a change in buyer and seller behaviors, which has shifted the market more than you would see in a typical year. As the purchasing power of prospective buyers declined, the number of new contracts started to fall as buyers either became more selective or took time away from the market. Year to date at the end of November, new contracts were down 20.5% from 2021. Fewer incoming contracts meant an increase in days on market, with homes in the Bright footprint hitting two weeks at the end of November.
The decline in buyer activity is also affecting prospective sellers. With fewer buyers and less competition, home prices have fallen from their peaks. This fact, along with the prospect of taking on a new mortgage at a much higher rate/payment than they are likely paying now, is making sellers hesitant to bring their homes to the market. New listing volumes in the Bright footprint are down 14.3% year to date as both buyers and sellers are contributing to increased inventory levels.
Counties with More Than a 50% Increase in Inventory
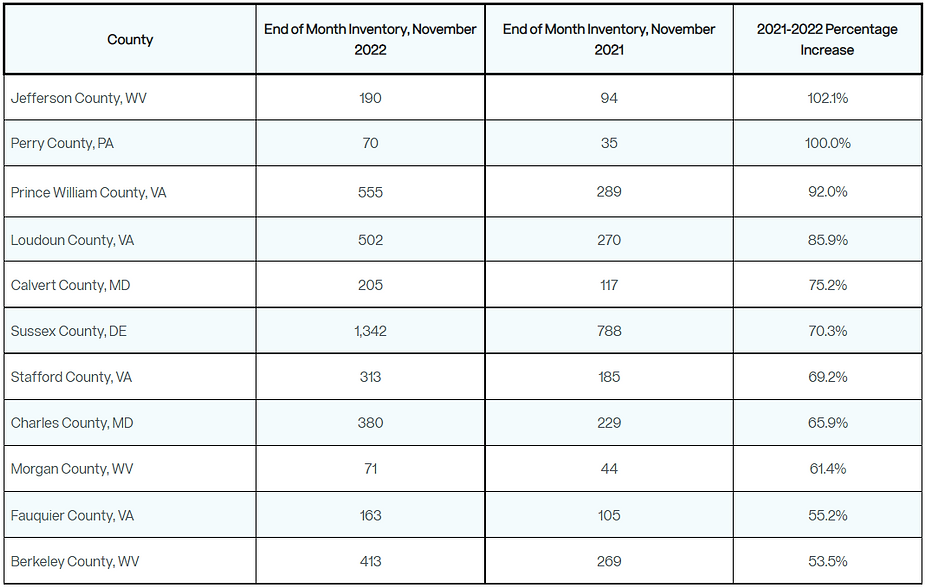
Noteworthy Numbers:
- In 6 of these 11 counties, new contracts have declined more than 20% year to date through November compared to 2021.
- In 8 of these 11 counties, new listings have declined more than 10% year to date through November compared to 2021.
- At the end of November, 5 of the 11 counties saw their days on market hit three weeks or more compared to last year. None of the 11 counties’ days on market is less than two weeks.
The Takeaway
Numerous counties are seeing increased inventory levels, a trend that will continue heading into 2023. For prospective purchasers, this allows for more options and a less competitive marketplace than normal ahead of the spring 2023 selling season. While increased inventory will allow purchasers to be more selective, Bright’s 2023 Market Forecast is calling for sales to fall around 4.6% next year. As the market transitions in 2023, inventory levels will be an important metric to monitor.
What You Can Do
Stay informed about housing market conditions with Bright’s housing market reports, and get a preview of future buyer activity by tracking the Bright MLS T3 Home Demand Index for the Philadelphia, Baltimore, and Washington regions.

Connor Christie serves Bright MLS as a Market Research Analyst. His focus is on analysis, commentary, and research related to Bright’s comprehensive array of real estate data. In 2021, Bright’s over 100,000 subscribers facilitated $142B in real estate transactions through its system stretching across 6 states and the District of Columbia.